> For the complete documentation index, see [llms.txt](https://developer.electroneum.com/llms.txt). Markdown versions of documentation pages are available by appending `.md` to page URLs; this page is available as [Markdown](https://developer.electroneum.com/etn-sc-client/monitoring/creating-dashboards.md).
# Creating Dashboards
There are several ways to monitor the performance of a Etn-sc node. Insights into a node's performance are useful for debugging, tuning and understanding what is really happening when Etn-sc is running.
## Prerequisites
To follow along with the instructions on this page it will be useful to have:
* a running Etn-sc instance.
* basic working knowlegde of bash/terminal.
[This video](https://www.youtube.com/watch?v=cOBab8IJMYI) provides an excellent introduction to Geth monitoring.
## Monitoring stack
An Electroneum Smart Chain client collects lots of data which can be read in the form of a chronological database. To make monitoring easier, this data can be fed into data visualisation software. On this page, a Etn-sc client will be configured to push data into a InfluxDB database and Grafana will be used to visualise the data.
## Setting up InfluxDB
InfluxDB can be downloaded from the [Influxdata release page](https://portal.influxdata.com/downloads/). It can also be installed from a [repository](https://repos.influxdata.com/).
For example the following commands will download and install InfluxDB on a Debian based Linux operating system - you can check for up-to-date instructions for your operating system on the InfluxDB [downloads page](https://portal.influxdata.com/downloads/):
```sh
curl -tlsv1.3 --proto =https -sL https://repos.influxdata.com/influxdb.key | sudo apt-key add
source /etc/lsb-release
echo "deb https://repos.influxdata.com/${DISTRIB_ID,,} ${DISTRIB_CODENAME} stable" | sudo tee /etc/apt/sources.list.d/influxdb.list
sudo apt update
sudo apt install influxdb -y
sudo systemctl enable influxdb
sudo systemctl start influxdb
sudo apt install influxdb-client
```
By default, InfluxDB it is reachable at `localhost:8086`. Before using the influx client, a new user with admin privileges needs to be created. This user will serve for high level management, creating databases and users.
```sh
curl -XPOST "http://localhost:8086/query" --data-urlencode "q=CREATE USER username WITH PASSWORD 'password' WITH ALL PRIVILEGES"
```
Now the influx client can be used to enter [InfluxDB shell](https://docs.influxdata.com/influxdb/v1.8/tools/shell/) with the new user.
```sh
influx -username 'username' -password 'password'
```
A database and user for Etn-sc metrics can be created by communicating with it directly via its shell.
```sh
create database etn
create user etn with password choosepassword
```
Verify created entries with:
```sh
show databases
show users
```
Leave InfluxDB shell.
```sh
exit
```
InfluxDB is running and configured to store metrics from Etn-sc.
## Setting up Prometheus
Prometheus can be downloaded from the [Prometheus](https://prometheus.io/download/). There is also a Docker image at [prom/prometheus](https://hub.docker.com/r/prom/prometheus), you can run in containerized environments. eg:
```sh
docker run \
-p 9090:9090 \
-v /path/to/prometheus:/etc/prometheus \
prom/prometheus:latest
```
Here a example directoy of /path/to/promethus:
```sh
prometheus/
├── prometheus.yml
└── record.geth.rules.yml
```
And an example of prometheus.yml is:
```yaml
global:
scrape_interval: 15s
evaluation_interval: 15s
# Load and evaluate rules in this file every 'evaluation_interval' seconds.
rule_files:
- 'record.geth.rules.yml'
# A scrape configuration containing exactly one endpoint to scrape.
scrape_configs:
- job_name: 'go-ethereum'
scrape_interval: 10s
metrics_path: /debug/metrics/prometheus
static_configs:
- targets:
- '127.0.0.1:6060'
labels:
chain: ethereum
```
Meanwhile, [Recording rules](https://prometheus.io/docs/prometheus/latest/configuration/recording_rules/) are a powerful feature that allow you to precompute frequently needed or computationally expensive expressions and save their results as new sets of time series. Read more about setting up recording rules at the [official prometheus docs](https://prometheus.io/docs/prometheus/latest/configuration/recording_rules/).
## Preparing Etn-sc
After setting up database, metrics need to be enabled in Etn-sc. Various options are available, as documented in the `METRICS AND STATS OPTIONS` in `etn-sc --help` and in our [metrics page](/etn-sc-client/monitoring/metrics.md). In this case Etn-sc will be configured to push data into InfluxDB. Basic setup specifies the endpoint where InfluxDB is reachable and authenticates the database.
```sh
etn-sc --metrics --metrics.influxdb --metrics.influxdb.endpoint "http://0.0.0.0:8086" --metrics.influxdb.username "etn" --metrics.influxdb.password "chosenpassword"
```
These flags can be provided when Etn-sc is started or saved to the configuration file.
Listing the metrics in the database verifies that Etn-sc is pushing data correctly. In InfluxDB shell:
```sh
use etn
show measurements
```
## Setting up Grafana
With the InfluxDB database setup and successfully receiving data from Etn-sc, the next step is to install Grafana so that the data can be visualized.
The following code snippet shows how to download, install and run Grafana on a Debian based Linux system. Up to date instructions for your operating system can be found on the Grafana [downloads page](https://grafana.com/grafana/download).
```sh
curl -tlsv1.3 --proto =https -sL https://packages.grafana.com/gpg.key | sudo apt-key add -
echo "deb https://packages.grafana.com/oss/deb stable main" | sudo tee -a /etc/apt/sources.list.d/grafana.list
sudo apt update
sudo apt install grafana
sudo systemctl enable grafana-server
sudo systemctl start grafana-server
```
When Grafana is up and running, it should be reachable at `localhost:3000`. A browser can be pointed to that URL to access a visualization dashboard. The browser will prompt for login credentials (user: `admin` and password: `admin`). When prompted, the default password should be changed and saved.
The browser first redirects to the Grafana home page to set up the source data. Click on the "Data sources" icon and then click on "InfluxDB". The following configuration options are recommended:
```sh
Name: InfluxDB
Query Language: InfluxQL
HTTP
URL: http://localhost:8086
Access: Server (default)
Whitelisted cookies: None (leave blank)
Auth
All options left as their default (switches off)
Custom HTTP Headers
None
InfluxDB Details
Database: etn
User:
Password:
HTTP Method: GET
```
Click on "Save and test" and wait for the confirmation to pop up.
Grafana is now set up to read data from InfluxDB. Now a dashboard can be created to interpret and display it. Dashboards properties are encoded in JSON files which can be created by anybody and easily imported. On the left bar, click on the "Dashboards" icon, then "Import".
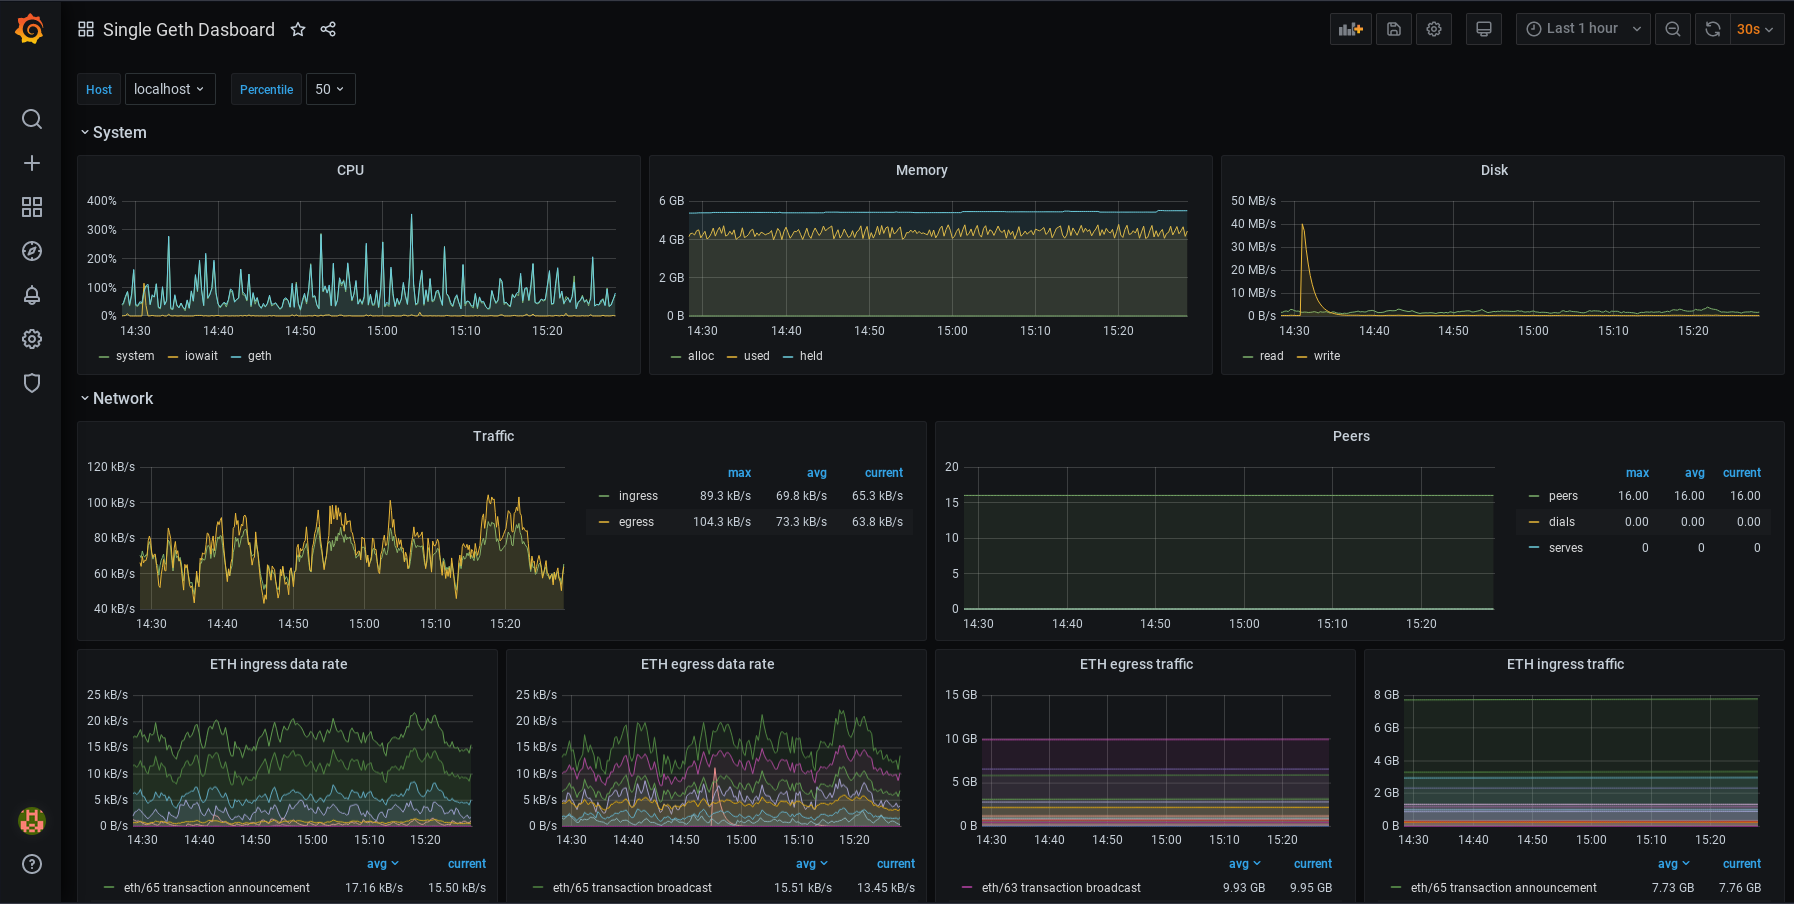
For a Etn-sc InfluxDB monitoring dashboard, copy the URL of [this dashboard](https://grafana.com/grafana/dashboards/13877/) and paste it in the "Import page" in Grafana. After saving the dashboard, it should look like this:
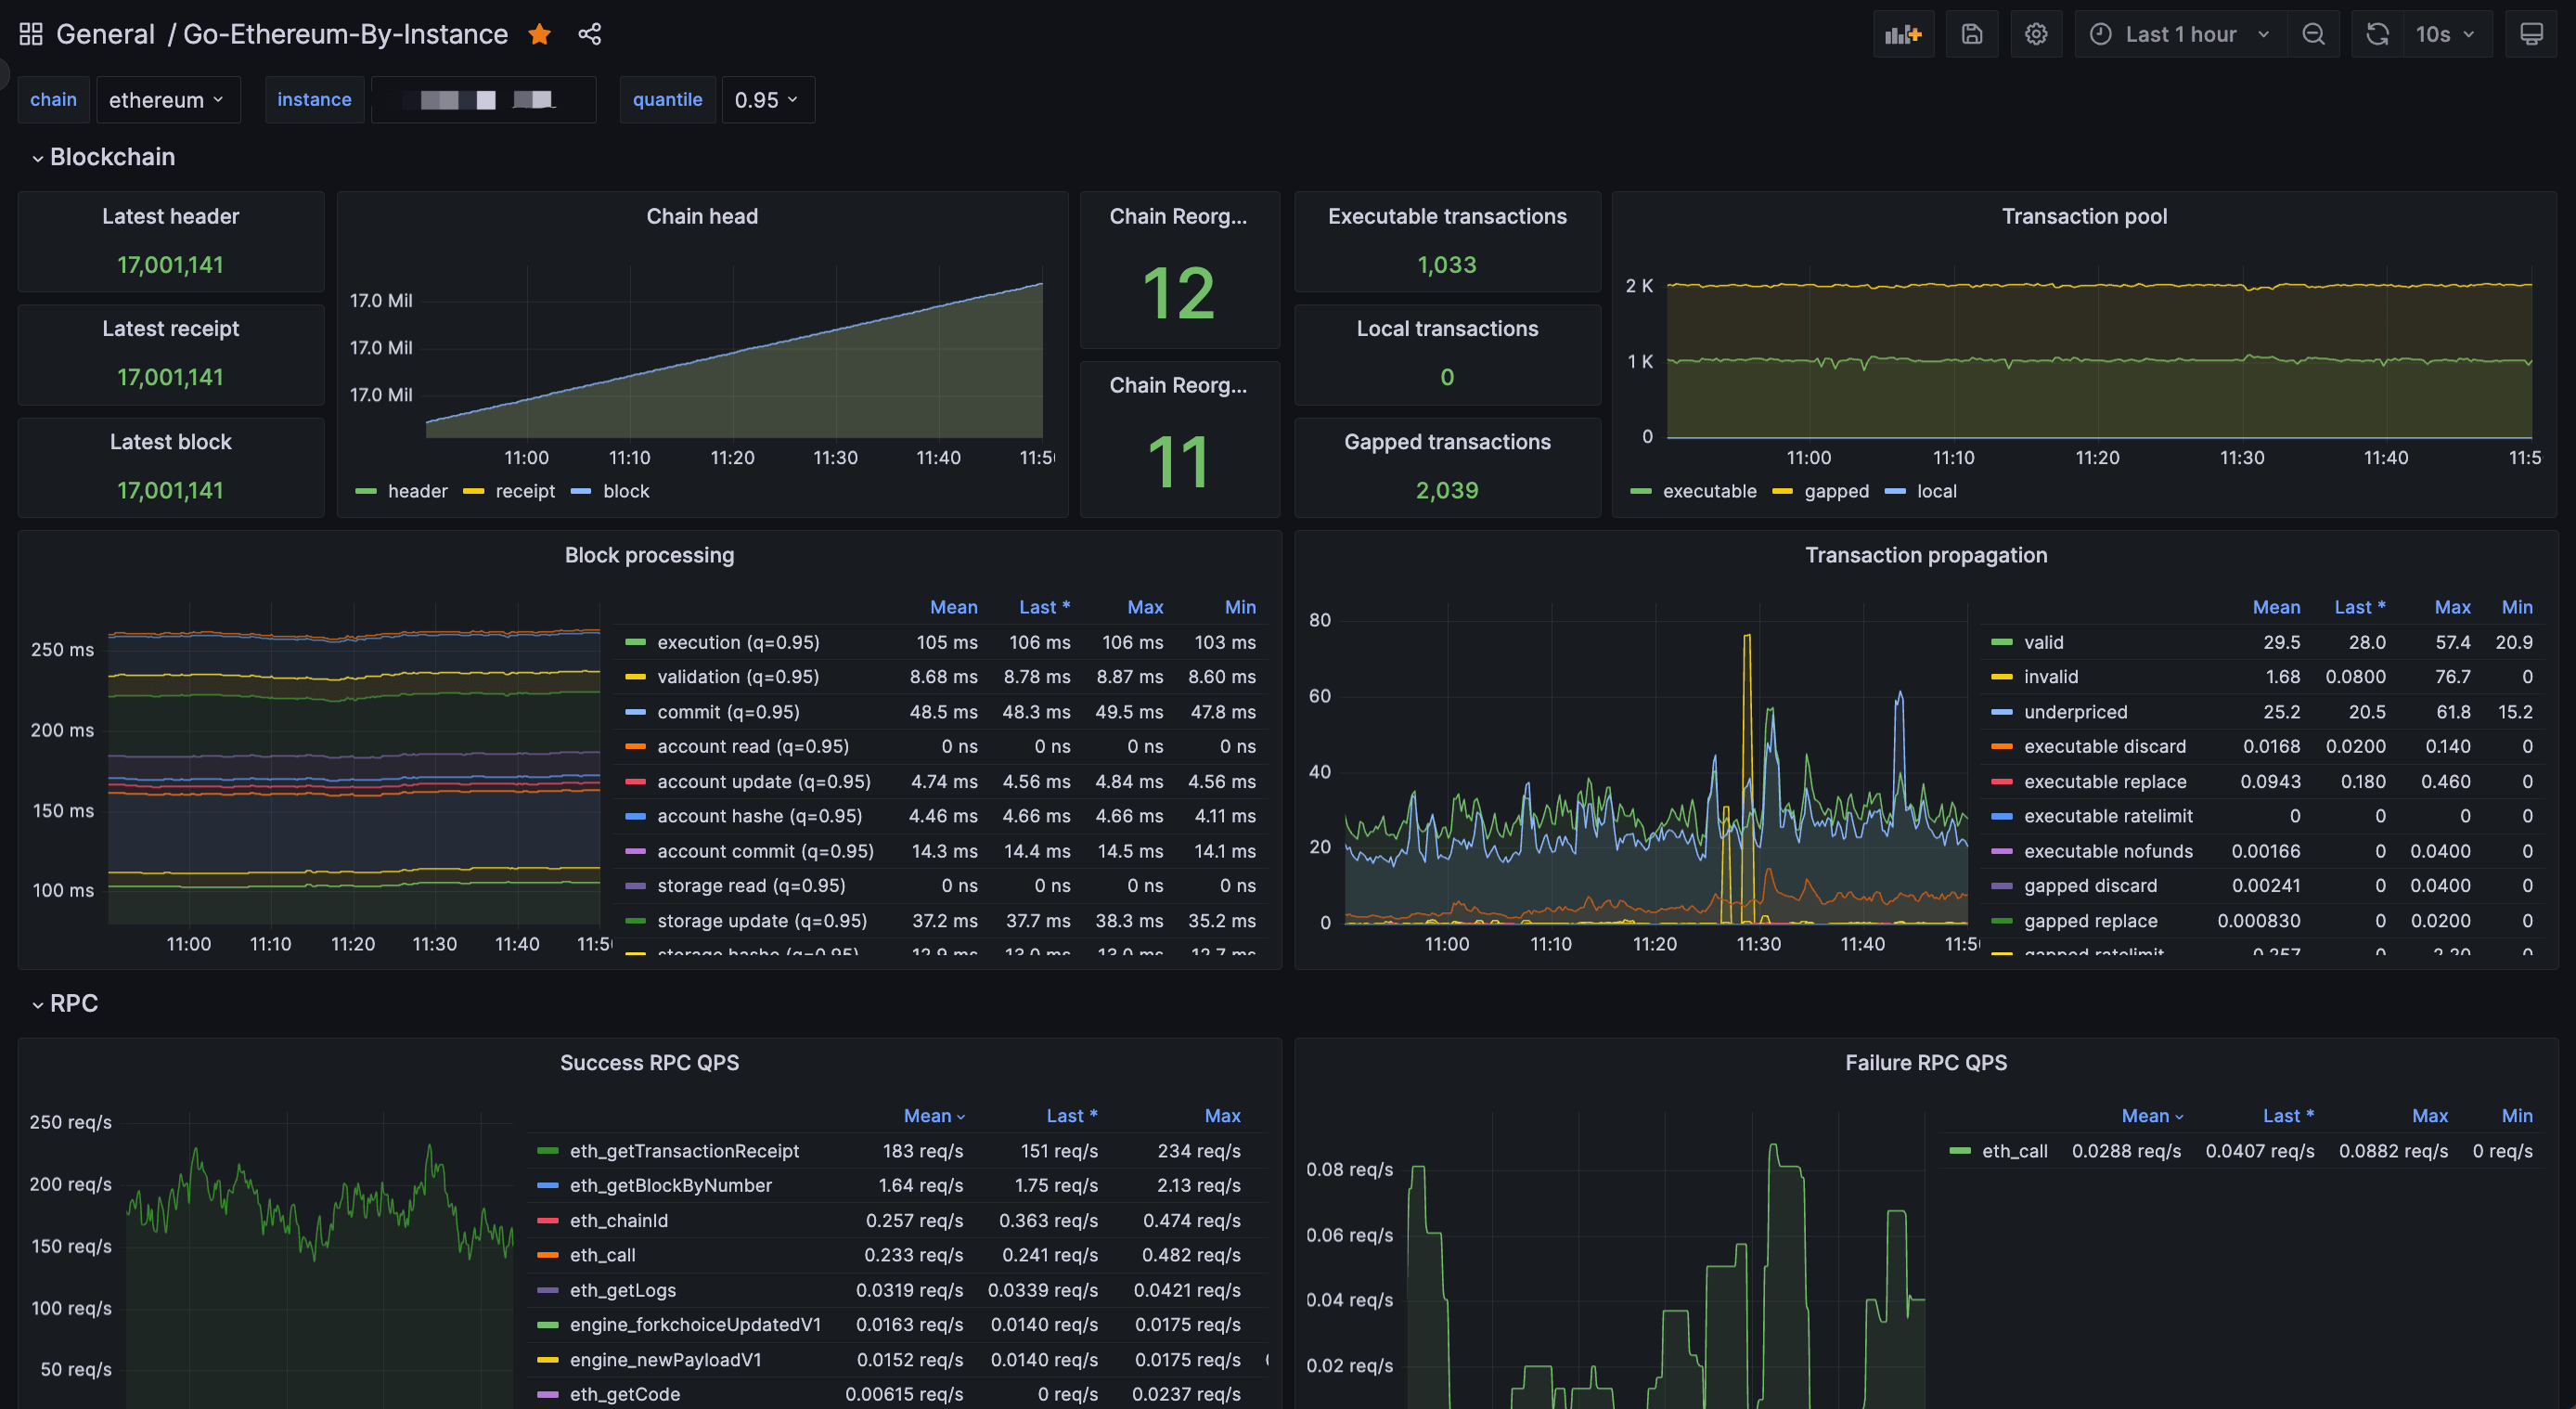
For a Etn-sc Prometheus monitoring dashboard, copy the URL of [this dashboard](https://grafana.com/grafana/dashboards/18463/) and paste it in the "Import page" in Grafana. After saving the dashboard, it should look like this:
## Customization
The dashboards can be customized further. Each panel can be edited, moved, removed or added. To learn more about how dashboards work, refer to [Grafana's documentation](https://grafana.com/docs/grafana/latest/dashboards/).
Some users might also be interested in automatic [alerting](https://grafana.com/docs/grafana/latest/alerting/), which sets up alert notifications that are sent automatically when metrics reach certain values. Various communication channels are supported.
## Summary
This page has outlined how to set up a simple node monitoring dashboard using Grafana.
***NB: this page was adapted from a tutorial on ethereum.org written by Mario Havel***
---
# Agent Instructions
This documentation is published with GitBook. GitBook is the documentation platform designed so that both humans and AI agents can read, navigate, and reason over technical content effectively. Learn more at gitbook.com.
## Querying This Documentation
If you need additional information that is not directly available in this page, you can query the documentation dynamically by asking a question.
Perform an HTTP GET request on the current page URL with the `ask` query parameter, and the optional `goal` query parameter:
```
GET https://developer.electroneum.com/etn-sc-client/monitoring/creating-dashboards.md?ask=&goal=
```
`ask` is the immediate question: it should be specific, self-contained, and written in natural language.
`goal` is optional and describes the broader end goal you are ultimately trying to accomplish on behalf of the user. GitBook uses it to tailor the answer towards what is most useful for that goal.
The response will contain a direct answer to the question and relevant excerpts and sources from the documentation.
Use this mechanism when the answer is not explicitly present in the current page, you need clarification or additional context, or you want to retrieve related documentation sections.